
A quick summary of our findings in 2023 (TL;DR):
- Our clickthrough rates increased by 121%.
- Conversion rates also increased by 47%.
- If you live in Central Colorado or Northern Minnesota, expect to pay more per click.
- If you live in a transition zone, you can expect cheaper leads than the rest of the US.
Sections
Welcome to our fourth year of analyzing our Google Ads for landscapers. 2020 was our inaugural year. In 2021 we analyzed search trends on a seasonal basis. In 2022 we dove into peak times of the day and week people search.
This year, we’re reviewing averages based on relative location in the United States.
National averages are great, but the United States is big. Different climates affect search results and market demand.
Overall Google Ads Performance
Here are the standard Google Ads performance metrics in 2023 vs 2022.

CPCs increased by almost $2 on average, but the cost per conversion dropped by the same amount. We believe that’s largely due to two main reasons:
- Attaining a much higher CTR
- Increasing conversion rates by 2 full points year over year
In 2023 we took a much more laser-focused approach on our keywords and ad groups we set up.
Most landscapers and agencies target keywords and create ad campaigns around low-volume keywords. When you do that, you end up paying higher CPCs because the supply of those searches is low.
An example would be targeting low-volume keywords like “fertilization” or “aeration”.
It’s basic laws of supply and demand. The more budget you put towards something with a limited supply, the higher the price.
Instead of targeting those smaller keywords with ads, we let SEO take care of those. Google Ads should be reserved for the broader terms. We talked about back in our 2020 post, “Google Ads Campaigns for Landscaping & Lawn Care“.
Between 2022 and 2023 we saw that Google was starting to play fast and loose with our keyword targeting. If we had a “lawn care” campaign for an LCO that only provided fertilization and weed control services, we’d only target “lawn care” as a keyword. Well, Google, for some reason, started showing our ads to “landscaping” queries.
This wasn’t something they did that we noticed in years prior.
This Will Get a Little Nerdy…
It doesn’t surprise us that this started happening in 2023 as Google came under fire for allegedly rigging the ad auction — inflating CPCs to meet revenue goals… which was later found to be true in leaked emails from Google execs.
Search terms started to get broader despite us only using phrase-match keywords. We cover “match-types” in this keywords beginner’s guide.
This largely went unnoticed. Google Ads doesn’t show you all the search terms you’re showing up for. They hide a ton of information. In early 2024, we found out just how much Google was hiding in the search terms report. When we negated question-related keywords, our 40% impression share dropped to 6%. Google was intentionally showing our ads to low-quality searches and not telling us.
Okay, Back to What You Care About
The TL;DR on the above is that we had to get stricter on negative keywords. If we’re targeting only “lawn care” as a service, we have to use “landscaping” as a negative keyword. It sounds insane… but that’s what it’s come to and has actually shown a drop in costs per conversion.
You wouldn’t think Google would blur these lines so much. They even differentiate the two in Local Service Ads and service categories in Google Business Profiles.
Google Ads Averages by Location
We grouped Google Ads metrics by zones. It isn’t something Google Ads does natively. It was a painstaking process but this industry is based on climate, not state borders. The national average isn’t indicative of your region. Northern lawn care businesses see big decreases in conversions and clickthrough rates as they head into the winter. Florida LCOs don’t experience that.
Grouping metrics by Zone eliminates the differences in seasonality by location.
Here’s a map for reference.

Clickthrough Rate (CTR) & Conversion Rate (CVR)
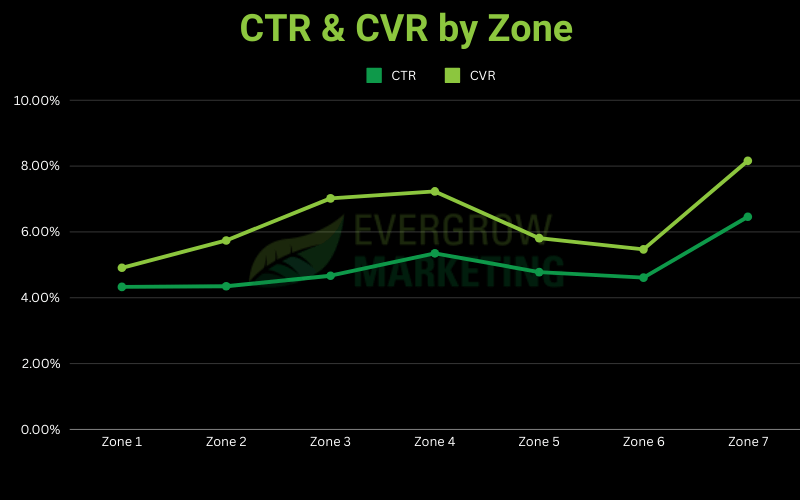
Zone 7 experienced higher average click-through and conversion rates than everywhere else. Keep in mind, there aren’t many Zone Sevens in the US aside from the Denver, CO area and the Northern part of the Midwest.
If we remove the Zone 7 outlier, the next thing we see are zones 3 and 4. These are client results from Northern Texas to Central Missouri. If you’re in this area, chances are, we’ll have pretty good success with your Google Ads campaigns.
Cost per Click & Cost per Conversion

Aside from the outliers (Zone 1 and Zone 7), we see that the more Southern our clients are, the more they pay per click. Based on this alone, the only real conclusion we can come to is the more South you go, the more competition you run into. When there is more competition, you can expect to pay higher CPCs.
If we look at the low CPCs in Zone 1 vs the high CPCs in Zone 7, we can look at the two main markets — Southern Florida and Denver, CO. If I were to guess, it’s that there is no shortage of higher income people in Southern Florida. I’d also say that there may be heavy physical competition, but the digital presence isn’t as competitive.
For the Denver market, we’ve spent a lot of effort looking at these specific clients. This isn’t a guess — Denver is competitive. There is a lot of opportunity for high-end landscaping in Denver. Landscape business owners also appear to be younger and more tech-savvy.

CPCs fluctuate in different zones. But we keep the cost per conversion in line from zone to zone. We may pay more for a click in the Denver market, but we can convert at a better rate. Better conversion rates even at higher CPCs lower costs per conversion.
The two outliers here are zones 2 and 4.
At first glance, it looks like we struggle with the Mid-South. But we have a few clients in Southern Texas and Central Florida that really know how much they’re willing to pay for a lead. They push their ad spend to their limits while increasing their average cost per lead. They’re fine with that. The problem with that is it makes our aggregated data look… not so great.
We have by far the best results in Zone 4, the transition zone. There’s a lot of greenery here, all types of grasses and trees, and plenty of opportunity. If I were to move anywhere in the US and take my shot at starting a lawn care company, it’d be in Zone 4.
Want to See More?
We’re always looking for new ways to view our data. If you want to see more of what we have, feel free to reach out and see how your ad performance compares.
0 Comments