
A quick summary of our findings last year (the TL;DR):
- Costs per click and costs per lead rose year-over-year, but by only a fraction compared to other people’s data.
- Both Google Ads and organic conversion rates dropped in 2021 vs 2020, but only marginally.
- This could have been due to the poor economic outlook a year after COVID.
- Although more visitors come from desktops, more people contact landscaping businesses via mobile devices.
- Make sure your website is optimized for mobile usability.
- Don’t pause your ads in the winter. The data shows that more people are actively researching in January versus any other month but wait until April to call.
- Costs per lead are half as much in January compared to December, but the people that are searching in December, convert at a higher rate than in January.
These findings were featured in Turf Magazine’s article, “Does Winter Marketing Make Sense for Lawn & Landscape Companies?“
Sections
Last year, we published the landscaping and lawn care digital marketing benchmarks for 2020. Really, it was tailored specifically to the SEO and Google Ads benchmarks we saw across all of our clients throughout the “entire U.S. of A.” as Cody put it. This year, we’re doing the same, but for 2021.
I wish we could have knocked this report out a lot earlier in the year. However, we hit a pretty hefty growth spurt in our business and had to put things like this on the back burner. Better late than never, I suppose.
Since then, we have had a lot more time to plan what we have found valuable in terms of SEO and Google ads metrics in the landscaping industry. Overall clickthrough and conversion rates aren’t going to cut it this time around. We want to be able to understand what the expected benchmarks are for our landscaping and lawn care clients based on the seasonality and service being searched.
In 2021, we reported that the average cost per lead in 2020 was $48.54 with Google Ads, but that doesn’t take into consideration the time of year the searches were taking place nor the type of service being searched for.
Having said that, I think our report needs to be a bit more comprehensive.
The following report is a collection of data for more than 30 of our landscaping and lawn care clients across the US.
Overall Google Ads & SEO Performance
Here’s a one-to-one graphic that compliments the one we did last year — with the addition of “Conversions by Device Type”.

The biggest changes we saw in the industry were related to ad performance. The clickthrough rate (CTR) dropped marginally while things like the average cost per click (CPC) and cost per conversion rose quite a bit. This is fairly predictable on a year-over-year basis as Google raises costs per click just due to inflation and demand.
When CPCs rise, the average cost per conversion typically rises with it. The more expensive a click, the more expensive it is to get someone to convert.
The data we’ve uncovered above reflects the industry others are seeing in terms of rising CPCs. Wordstream reported that the Home and Garden CPCs for Google Search in 2020 were $4.07 but rose 41% in 2021 to $5.75 per click. Their data is a bit broad in terms of the industry type, but it’s relatively close to the landscaping and lawn care industry — only our CPCs aren’t that high nor did they rise by 41%. We only saw a 13% rise.
We also saw a huge increase in desktop traffic versus mobile — which means more people seemed to research on desktop versus mobile. This could be because everyone started returning to the office.
47% of traffic in 2020 was mobile while in 2021 that percentage dropped to 36% and desktop picked up the rest.
Users Vs Conversions by Device Type
A new metric we added this year was “Conversions by Device Type”. I felt this was important as we had always speculated that most people do their research on mobile devices but actually make the contact (conversion) via desktop. Additionally, other sources and studies have suggested that mobile website optimization increased the friction with users taking the conversion action.
However, according to our data, it’s very clear that the previous speculation is either not true in the landscaping industry or the mobile versions of our websites work extremely well.
Our data above shows that although 61% of users to websites visit via desktop while only 36% visit via mobile, those metrics are flipped when it comes to users who have actually converted. This leads me to think that people research on desktops but ultimately convert on their mobile devices.
An argument can be made that our desktop optimization isn’t as good as our mobile conversion optimization based on the data above. After reviewing our average organic conversion rates, we’re seeing 8.44% in 2021 vs 9% in 2020.
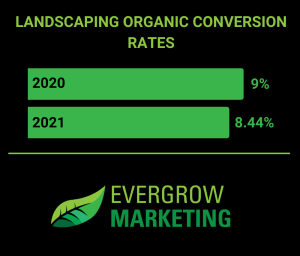
9% down to 8.44% is a 6.22% decrease in conversion rate for organic visitors, however, if you recall previously our Google Ads conversion rate dropped as well from 6.59% down to 6.06%. That’s an 8.04% decrease — meaning, conversion rates fell in both search engine sources (organic and PPC).
The less than 10% drop in both organic and PPC suggests that users were slightly less likely to convert in 2021 versus 2020, a year after COVID.
Google Ads Performance By Season
This is the section I was most excited to drive into and write about.
Knowing industry trends as generalities gives us insight into what to expect during an entire year, but in the landscaping industry, it’s completely different with the seasonality.
In this section, I’ll dive into the trends of how many people were searching for lawn and landscaping services (yes, this applies to hardscapes as well) and how many people were actually turning into leads based on the month and seasonality of the year.
Impressions vs Budget
For this subsection and the following, we’re going to be taking a look into Google Ads metrics because that will give us the most accurate representation of what’s being searched versus what Google gives us access to regarding organic search queries.
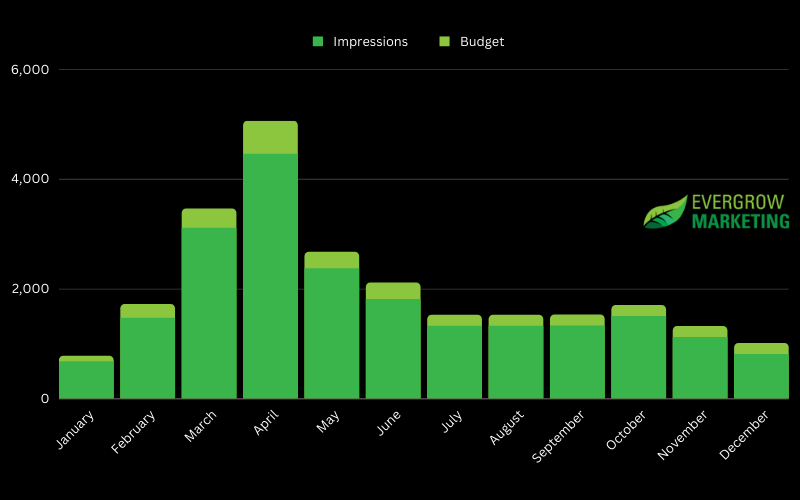
This first image shows us how many impressions are being delivered versus our clients’ average budgets. In other words, how many people are searching for lawn care and landscaping keyword we’re targeting in their ads campaigns?
A general observation is that as we get closer to the winter months, ad budgets drop. We often recommend this heading into November, but not turning off ad spend completely. Search traffic is lower but it’s not non-existent (we’ll cover this more in the next subsection).
You’ll also see impressions and ad budgets spike in March and April but start to taper off right after April and then level out from June – November.
This shouldn’t be surprising information. If you’re a landscaper and you have money to spend, January through June is when you should be increasing your marketing budget.
Monthly Clicks Vs Impressions
This graph pretty much mirrors the previous graph. It shows how many clicks were made on ads for keywords we were targeting vs how many times the ads showed up. In other words, how much were people searching vs how many of the people searching were actually taking action?

None of this should be surprising either at first glance. As your budget increases, your ad gets served more and thus, in theory, more clicks, which in turn typically means more conversions
What’s difficult to see is the disparity between the number of clicks on an ad versus how many people actually took the action to convert to a lead given the month.
For example, in January, the actual data shows an average of 673 impressions, 47 clicks, and 2 conversions (based on $100 spent). That’s a clickthrough rate of 6.98% and a conversion rate of 4.26%.
As you can see, the average clickthrough rate in January was 58% higher than our yearly average at the top of this report — but the conversion rate is 42% lower in January than the yearly average.
In April, the clickthrough rate is 3.7% (19% higher than the yearly average) while the conversion rate is the largest of the entire year at 10.3% (70% higher than the yearly average).
Why is that?
That’s a great question. I’m glad you asked.
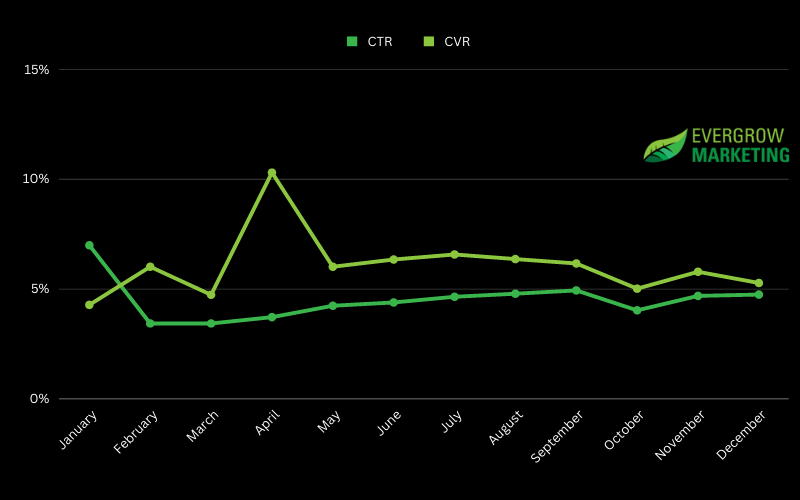
This graph is a visual representation of the clickthrough rates (CTR) and conversion rates (CVR) on a monthly basis.
What it’s showing us is that the people who are searching for landscaping and lawn care services are clicking and researching more than any other month in January, BUT they’re not contacting businesses until April.
If you decide to shut off ads and marketing for your landscaping business between November and March because you think no one is looking for lawn care and landscaping services, you’re missing out on all of the people who started their searches in December, yet peaked in January.
If all of our clients shut off their ads throughout the Winter, I would imagine their conversion rates in April wouldn’t be as high.
Cost Per Conversion By Month
Let’s do one more.

This is a graph indicating how much landscapers can expect to pay per lead with Google Ads on a month-to-month basis.
We know that conversion rates are highest in April while they’re the lowest in January. What this graph is telling me is a few things:
- April has the highest conversion rates, therefor the cost per acquisition (lead) is only around $35 versus the yearly average of $52.36.
- April’s low CPA can be due to high engagement in January. Without that high January engagement, April may not have such a low CPA.
- Even though December’s conversion rate is actually higher than January, the cost per acquisition is double. This tells me that there are fewer people searching, but those that are searching in December convert at a higher rate than those searching in January.
- You might pay more per lead in the winter months, but it pays off in April.
That’s All
We took a lot of time pouring through our data to provide this report to you. I hope you enjoyed it and gained something valuable from it.
If you have any questions about a further in-depth analysis of the data reported above, feel free to leave a comment below.

0 Comments