
A quick summary of our findings in 2022 (TL;DR):
- There was a significant increase in cost per click and cost per lead.
- Costs per lead are around $50 in the spring, nearly $100 in the summer, and over $200 in the winter.
- Your Google Ads budget should be significantly higher in the spring than in the winter. At least 4x.
- The best time to run ads during the week is Monday through Thursday between 8:00 AM and 4:00 PM (the workday — just not Friday).
Sections
- Overall Google Ads Performance
- Google Ads Performance by Season
- Google Ads Performance by Day of the Week
- Google Ads Performance by Time of the Day
Every year, we at Evergrow Marketing review industry benchmarks for Google Ads in the lawn care and landscaping industry based on the ads we run for our clients. Sometimes the growth and work associated to managing client accounts and campaigns exceeds the capacity we have to do these reports in a timely manner. So here I am in 2024 recapping 2022.
For the past two years, these reports have served as an expectation of what landscaping and lawn care business owners could expect with optimized Google Ads campaigns. However, the more we run these reports the more we find different metrics piquing our interests.
Case studies on individual client wins only highlight what we want you to see. This way, we get to show you how everything performs on average without cherry-picking successes for case studies.
Publishing these reports on our website is for you. Doing the research and analysis is for us.
Overall Google Ads Performance
Here are the standard performance metrics we look at first regarding Google Ads this year vs metrics last year.
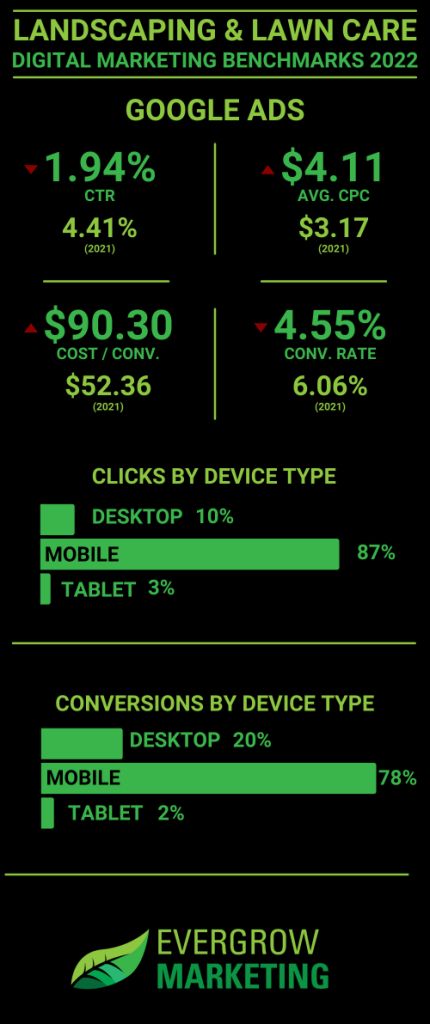
One thing is for sure and that is that Google increases CPCs every year. We expect the Cost per Click to increase every year with Search Ads. To combat that, we need to focus on getting more of the people who do click to contact us — or rather, our clients.
If 100 people click on an ad that costs us an average of $4.11 per click, that’s a budget of $411 for a month, but only 1.94% of the people who saw our ad clicked, which means there were 1,254 people who made a search using similar keywords to what we were targeting. Out of the 100 people who clicked, 4 of them landed on the website and decided to call or fill out a form on the website for lawn care and landscaping services.
That would cause our cost per lead to be $102.75 in this example. Our actual cost per lead was $90.30 which was 72.46% higher than last year.
What if our conversion rate was 8% instead of 4.55% — we converted 18 people instead of 4 out of the 100 clicks. That would drop our cost per lead down to $51.37. Suddenly, we’re back to 2021 numbers. Google’s CPCs increased by 30% according to our metrics which helped cause our CPA to shoot 72%. We can’t do much to control CPC but we can do more to help drop our CPA by getting more leads out of the clicks we get.
Increasing the conversion rate with Google Search ads is currently one of our primary focuses, especially after seeing how much CPCs have risen.
Google Ads Performance By Season
Just like 2021, this section will focus on Google Ads performance for landscapers by the month.
Average cost Per Lead by month
The below graph is the average cost per lead per month we get with Google Ads for landscapers (and lawn care companies).
It’s easy for us to say that we averaged $85.57 per lead, but that’s over the entire year in all regions. This graph shows where the low and the high CPAs are weighted.
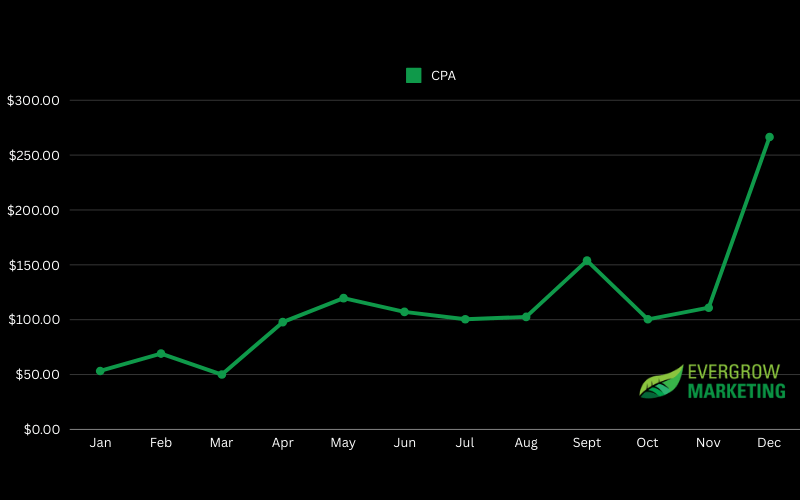
This chart is very indicative of budgets and search volume. If your budget is $250/mo, in March, you could expect 5 leads — but in December, you could only expect 1 lead.
If you’re in the North, you might be wondering what kind of leads you would be expecting in December. Keep in mind, that this is across all of our accounts all over the US which includes Southern states, tree removal companies, and snow removal companies. Leads for Northern lawn care companies also include clients who are looking to get on next year’s mowing schedule.
Average Cost Per Click by Month
This graph shows the average cost per click over each month. CPC is influenced by a lot of things.
- Google Ads competitors
- Search demand / Impression share
- Ad quality
- And more
Additionally, CPC influences CPA so it’s in our best interest to keep CPC as low as possible in order to get leads for our clients at a cheaper rate.
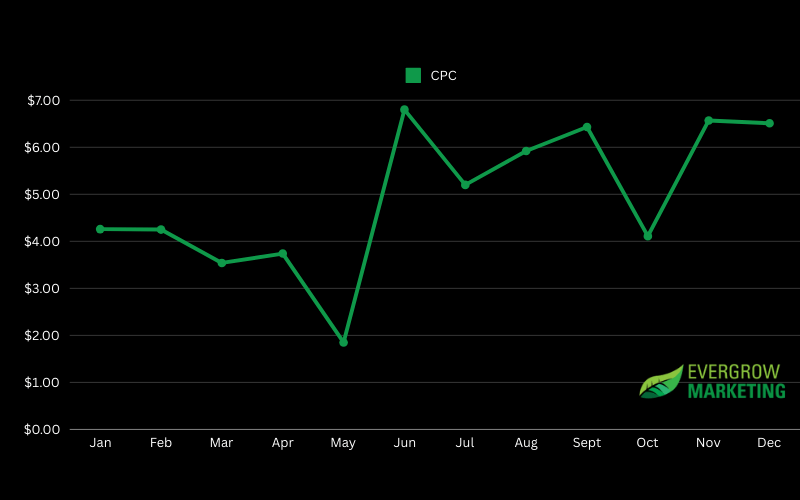
One might think that this graph would almost identically match the CPA-by-season graph. It kind of does, but not exactly.
We see dips in April and May and with sharp upticks in November and December. This is actually pretty easily explainable with impression share and market demand (which I explain in the Average Budget by Month section below).
TL;DR — the less demand there is and the more you want to spend, the more you’ll pay for a click. If you match the budget with the demand, you can keep your CPCs down.
Engagement and Conversion Rates by Month
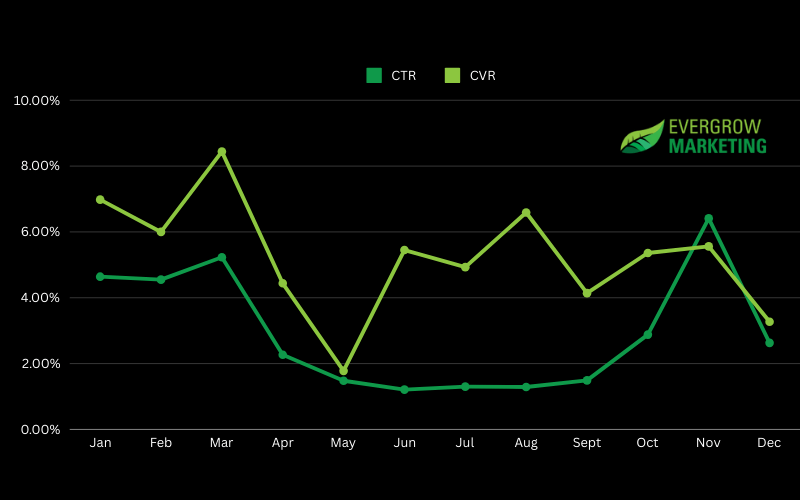
Clickthrough Rate (CTR) and Conversion Rate (CVR) are two very important metrics Google Ads specialists focus on. CTR tells us how engaged people are with our ads. It’s the amount of people who clicked on an ad divided by the number of times our ads showed up. Conversion rate is the number of people who turned into a lead after they clicked.
One thing to consider between the 2022 data and the 2021 data is that there is a lot more of it this time around as we as a company have grown in the number of clients and ad accounts we’re managing.
Having said that, just as expected and like last year, we see seasonal trends related to engaging in research for lawn care and landscaping companies (CTR) and people actually pulling the trigger and contacting landscapers through Google Ads (CVR).
The main differences this year vs last year are:
- The Conversions came earlier. In 2021, the wave of new customers came in April. In 2022, it was March.
- Conversion rates were higher at the beginning of the year in 2022 than 2021. More people were looking earlier.
- CTR was a lot lower throughout the summer in 2022 than 2021.
- We saw the highest CTR in November whereas in 2021, the highest CTR was in January.
Average Budget by Month
Because we’re in a seasonal industry, search demand changes and budgets need to be adjusted due to that. Every month we’re consulting with our clients on how much money they can or should be spending based on past and current data.
This graph shows the average budget (100% being the maximum average for a month and 0% being the minimum) against the average impression share each month.
For clarity’s sake, impression share (IS) is the percentage your ad shows up when someone searches a keyword you’re targeting. If you show up 65/100 times for “lawn care near me”, you have a 65% impression share.
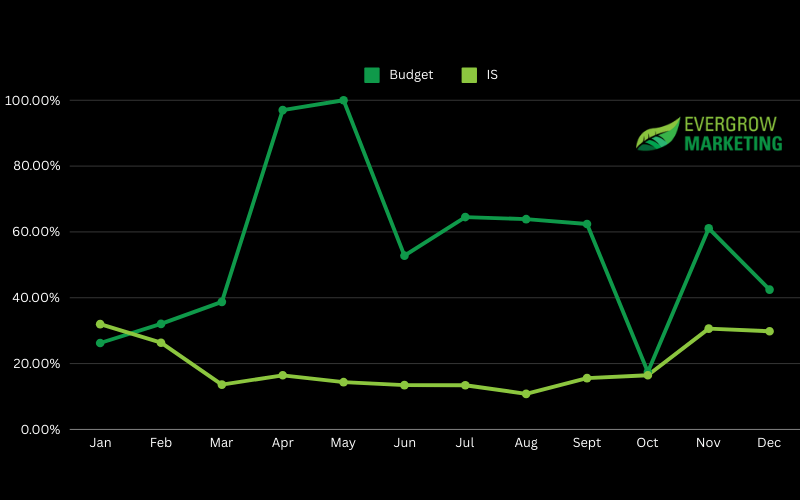
This graph is very indicative of what we tell our clients. You should never shut off your ads, but you should control your budget based on the season.
Typically, as there are more searchers, the overall impression share drops. When impression share drops, the amount you can spend on Google Ads increases. That’s why we see huge budgets in April and May but the impression share stays low. The roof for your budget is exponentially higher than your roof in the winter.
Speaking of winter… You’ll start to see that impression share increases as winter demand dies down. Budgets in November matched budgets in July and August but impression share increased. That tells me that there were fewer searchers in November.
Pay attention to your impression share. Impression share can tell you what your budget should be based on market demand.
Another thing about impression share is that the higher you go, the more expensive your clicks get. 65% is generally the point at which you start paying significantly more per click. As an example, you might notice that in April, you’re hitting a 20% impression share with a $500 budget but in July, your impression share might skyrocket to 75%. This is a clear indicator that you should be reducing your budget due to the lack of search demand.
Google Ads Performance By Day of the Week
Now for the new data for 2022.
In 2021, Seasonal trends and metrics were the new thing. Now that we’ve been able to proactively recommend budgets and anticipate CPCs and CPAs with seasonal data, we took it a step further and looked at when in the week people tend to search, engage, and convert.
Recently, I was asked if we see increases in searches for lawn care and landscaping services on the weekend. The answer is a little more complicated.
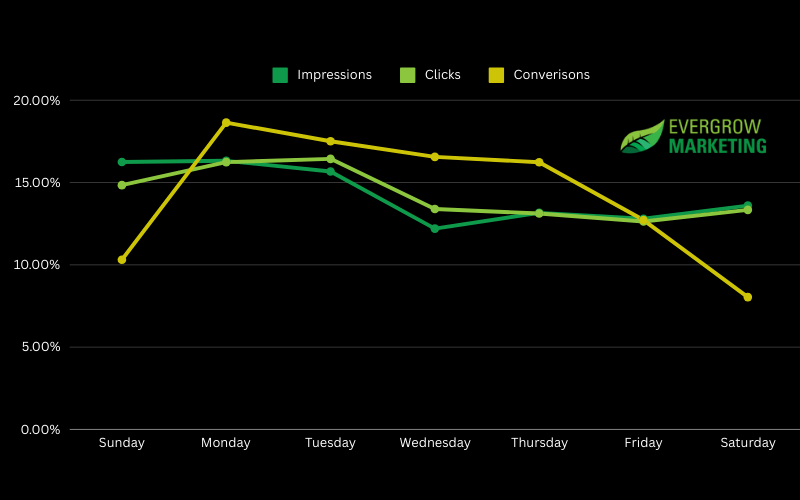
What the data shows us is that we see higher impressions and clicks on Sunday and Monday with the lowest search volume towards the end of the week.
When we ask ourselves when people are searching, the answer is primarily at the beginning of the week. What’s important to us are the searchers that are converting. We want to primarily spend money on those searchers (the yellow line).
With that in mind, understanding this data has influenced us to increase CPC bidding during the weekdays. Since that’s when the converting people are searching, we’re willing to pay more for those searchers than the searchers on the weekend.
So to answer the question, “do people search more on the weekends?”… Yes, but the people who turn into leads don’t.
Google Ads Performance by Time of the Day
Let’s take it a step further. What time of the day are people searching and converting?
Most people (including us) might think that the majority of people looking for landscaping and lawn care services are looking after work on the weekdays or on the weekends. However, from our day-of-the-week analysis above, we have already determined that the weekend is not the answer.
Let’s take a look at the graph below for the time of day.
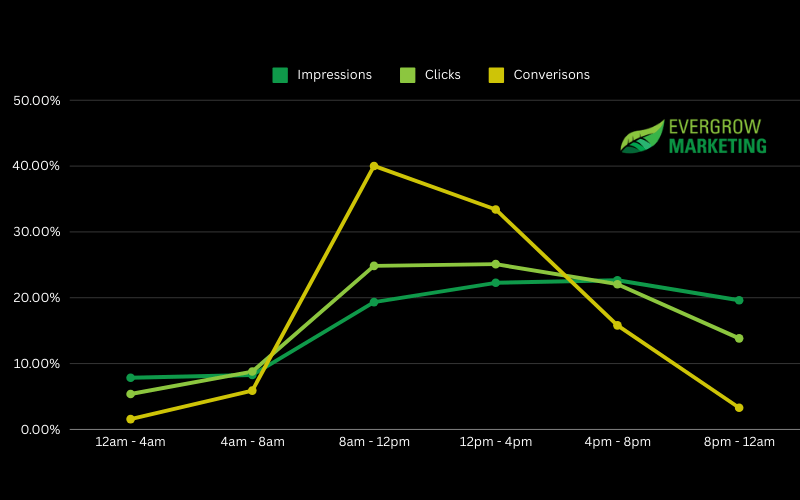
The first thing that sticks out is that most impressions, clicks, and conversions take place between 8:00 AM and noon. The second most is between noon and 4:00 PM. This 8-hour time stretch is quite literally during the work day.
From the day-of-week data and the time-of-day data, we can make one glaring analysis…
People look for lawn care and landscaping services during the work week and the work day.
If you’re going to increase bids for the most valuable searchers, it should be from Monday through Thursday between 8:00 AM and 4:00 PM.
Want to See More?
Let us know if there is any other data you’d like to see as a landscaper or LCO. We have access to over 50 active ad accounts across the US in the green industry and there are hundreds of ways to slice this data. We sliced it the way the gives us the best actionable insights for our clients — but if there is something you’d like to know, reach out to us and we’ll let you know what we see!
I need to know how much to per
ad 360.220.8728
juan