
Table of Contents
You can see a much more condensed version of this geotagging article on Search Engine Land.
Abstract
This study reviews how manipulating the longitudinal and latitudinal coordinates of image EXIF does or does not have an impact on local Google Business Profile rankings. We found that geocoordinates added to EXIF data have no overall effect on local ranking nor does it have an effect on ranking related to keywords that include a location when the coordinates match that location.
However, we found that adding geocoordinates in EXIF data for target areas will lead to a net improvement in local rankings 70% of the time with 97% certainty with “near me” queries related to the location targeted in the geocoordinates of the EXIF data.
Introduction
The SEO community has been torn between whether or not Google uses “geotagging” within the image meta and EXIF data to improve local ranking signals on Google Business Profiles.
It’s torn between SEOs who vehemently argue that geo-modified EXIF data using coordinates improves rank and other SEOs who say it has no impact.
Without testing, it’s impossible to know unless it comes directly from Google’s mouth (which it hasn’t). When images are uploaded to Google Business Profiles, the EXIF data is stripped. Some argue that Google uses the EXIF data for ranking purposes but strips it publically.
The problem with both of these beliefs is that it needs to be tested and neither party is doing the testing justice.
Those saying it does work aren’t publishing their results nor are their tests properly conducted. Those saying it does not work don’t have statistically significant sample sizes and lean on the side of subjectivity rather than objective reasoning.
Joy Hawkins published her geotagging results in 2024 and Tim Kahlert published a similar geotagging study a month later.
I admire people like Joy and Tim for spending their time conducting these tests and publishing their results publicly, but I felt a need to expand further on them and isolate more variables with a larger sample size and testing time period.
Methodology
In order to produce a statistically significant and objective view on whether geotagged EXIF data had an effect on Google Business Profile ranking, we had to establish what the others haven’t.
- A proper control period
- Variable isolation (including niche and industry)
- Significant sample size
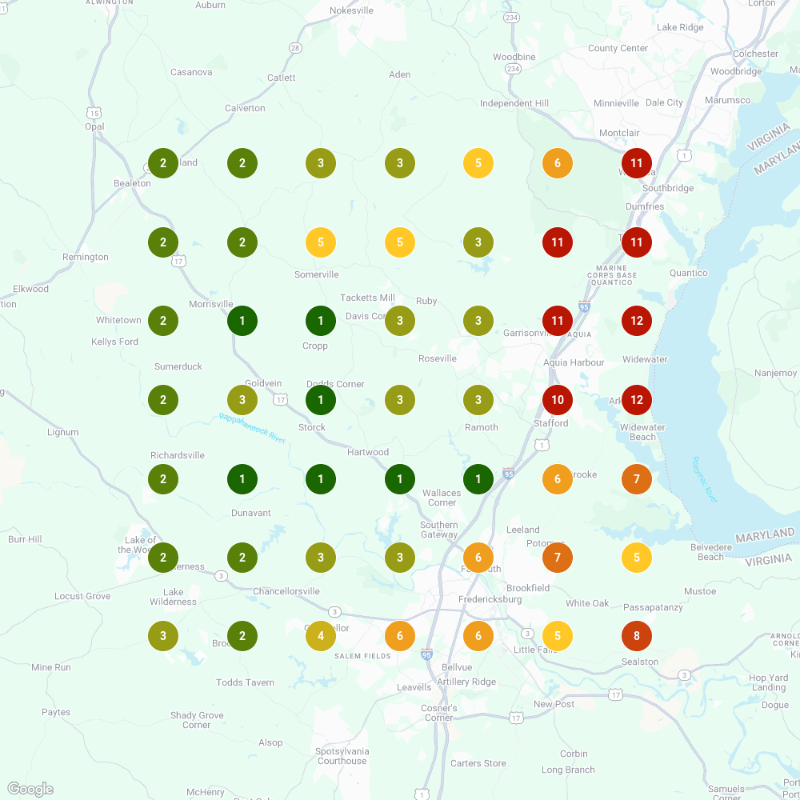
Our methodology consisted of a 5-week control period in which we uploaded two images to 27 lawn care businesses’ Google Business Profiles each week and tracked keyword positions using specific keyword variables. While doing this, we monitored multiple towns.
For transparency purposes, the local ranking tool we used was Local Falcon.
Control Period
Images were consistently uploaded every Tuesday and Thursday to isolate any potential influences in rank by day of the week.
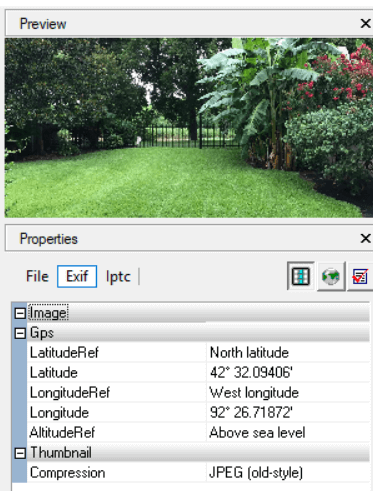
All images uploaded during the control period were stripped of their EXIF data prior to upload.
All images were owned by the businesses and were not stock photography or AI-generated.
No other SEO was done to these businesses on or off of their website.
The purpose of this control period was to ensure that the act of simply uploading consistent images to the businesses’ Google Business Profiles wasn’t influencing rank on its own.
Test Period
In the test period, we maintained everything in the Control Period, except the geotagged EXIF data.
We stripped all of the EXIF data and added coordinates to the data targeting a specific town that needed improvement. We used coordinates for one town on Tuesday’s image and coordinates for another town on Thursday’s image.
We then tracked keyword rankings for each town each week.
The keyword variables we used were:
- “Lawn care [target town #1]”
- “Lawn care [target town #2”
- “Lawn care near me”
For “lawn care near me”, we tracked how it influenced the rank in the two target towns when the query didn’t specify the town, but the geotagged images did.
We wanted to see if geotagged images did affect rankings, and did it make a difference if the keyword included a city name or not.
Results
The results we found were interesting. They were what we were expecting in some situations but not what we were expecting in others.
Understanding the Data
Our EXIF data test began on 09/27/2024 and ran until 12/01/2024. The control period rank ran from 09/27/2024 to 11/01/2024.
The data in the figures below may be hard to decipher so I’ll break out a few key concepts that should make it easier to match my analysis up with the posted charts.
The top of each chart shows the keyword we’re targeting. In Figure 1, it is targeting “lawn care” plus the targeted town indicated in column B.
The start of the control period and the towns’ corresponding local rank in Local Falcon are indicated in column C.
Column I indicates where the Control Period ended and the Test Period began.
These charts show rank “shift” as in positions changed from the previous week. If you see a red “-1” that means the position got one worse over the previous week (i.e. going from position 10 to 11).
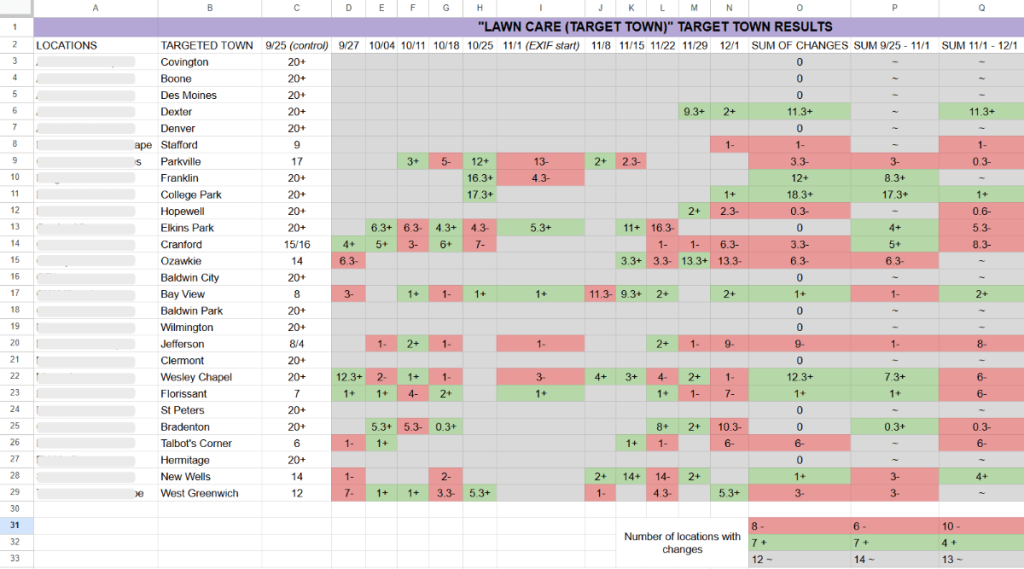
The bottom right of the charts shows the important data. This is where the analytics conclusions are drawn.
Referencing Figure 1, the area where it notes “Number of locations with changes” indicates how many locations dropped in rank (red), how many increased (green), and how many had no changes (gray). It further segments this by in total (column O), during the Control Period (column P), and during the Test Period (column Q).
Below that are “Average Drops” and “Average Increases”. Average Drops calculates, “Of the 8 locations that saw drops in the section above, how many positions on average were the drops?”
Average Increases show the opposite.
These were calculated to demonstrate the impactfulness of rank increases and decreases (i.e. 10 locations dropping 1 position over 5 weeks may not be as impactful as only 4 locations dropping 10 positions over 5 weeks).
Each chart will show a different data set that draws different conclusions.
These conclusions are mine. You may draw your own.
Test #1: “Lawn Care [Target Town]”
In the first test, we reviewed how the geotagged EXIF data affected the keyword rank for the corresponding target town that the EXIF data targeted.
Referencing Figure 1 above, we saw the following changes:
Control Period (9/25/24 – 11/1/24)
During the control period, there were 60 total position changes with a net gain of 24 positions.
6 Locations lost position
- The average position drop was -3.
- 18 Total drops
7 Locations gained position
- The average position increase was 6.
- 42 Total increases.
14 locations had no change
EXIF Test Period (11/1/24 – 12/1-24)
During the Test Period, there were also 60 position changes with a net loss of 24 position drops.
10 Locations lost position
- The average position drop was -4
- 40 Total drops
4 Locations gained position
- The average position increase was 5
- 20 Total increases
13 Locations had no change
Conclusion:
The Control Period performed 76% better than the EXIF Test Period in terms of total location rank increases with 85% certainty; which is statistically insignificant.
The Control Period had 60 position changes which resulted in a net of 24 position increases while the EXIF Test Period ended with a net loss of 20 positions.
Adding EXIF data allegedly had no impact. However, the control period seemed to have kept net loss to a minimum when no EXIF data was specified.
Test #2: “Lawn Care Near Me” (Target Town #1)
The second test mirrored the first test but instead of targeting a specific town in the keywords, we looked at the general “near me” keyword. We monitored how the geotagged images affected the rank of the location the coordinates matched against “near me queries”.
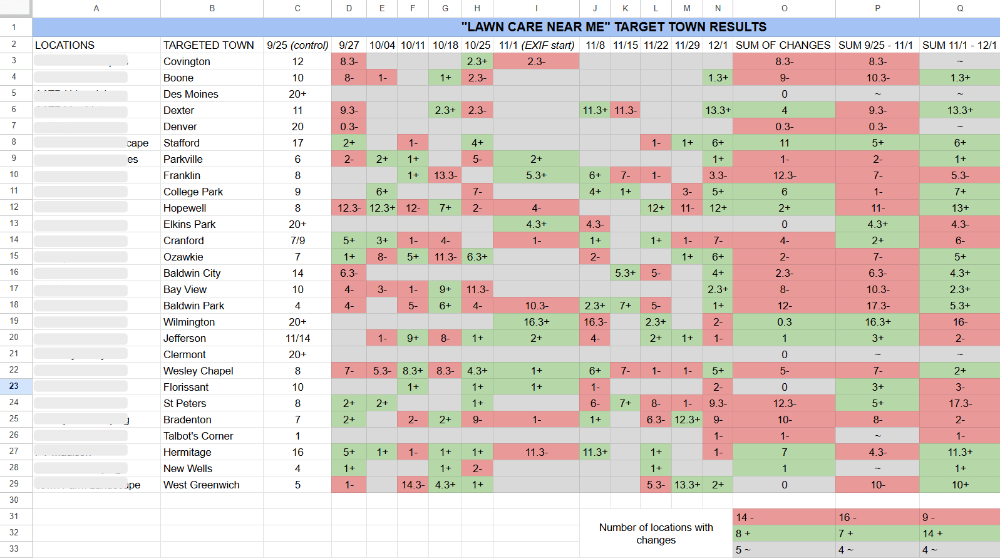
Control Period (9/25/24 – 11/1/24)
During the control period, there were 154 total position changes ending with a net loss of 70 position drops.
16 Locations lost position
- The average position drop was -7
- 112 Total drops
7 Locations gained position
- The average positioned increase was 6
- 42 Total increases
4 Locations had no change
EXIF Test Period (11/1/24 – 12/1-24)
During the Test Period, there were 138 total position changes ending with a net increase of 30 positions.
9 Locations lost position
- The average position drop was -6
- 54 Total drops
14 Locations gained position
- The average position increase was 6
- 84 Total increases
4 Locations had no change
Conclusion:
No. of Locations with Positive Rank Change
The EXIF Test Period performed 100% better than the Control period in terms of total location increases with 98% certainty; which is statistically significant.
Total Rank Changes
The EXIF Test Period had 138 position changes which resulted in a net of 30 position increases while the Control Period ended 154 position changes with a net loss of 70 positions.
Adding EXIF data allegedly had a positive impact in both numbers of locations with increased rank and total positions increased per location.
Test #3: “Lawn Care Near Me” (Target Town #2)
Because we uploaded two images per week (each image’s EXIF data targeting a different town), we reviewed the results from both towns and how “near me” queries affected their respective locations. Test #3 shows how the second location was affected.
Control Period (9/25/24 – 11/1/24)
During the control period, there were 127 total position changes ending with a net loss of 43 position drops.
17 Locations lost position
- The average position drop was -5
- 85 Total drops
6 Locations gained position
- The average position increase was 7
- 42 Total increases
4 Locations had no change
EXIF Test Period (11/1/24 – 12/1-24)
During the Test Period, there were 126 total position changes ending with a net loss of 14 position drops.
10 Locations lost position
- The average position drop was -7
- 70 Total drops
8 Locations gained position
- The average position increase was 7
- 56 Total increases
8 Locations had no change
Conclusion:
The EXIF Test Period performed 34% better than the Control period in terms of total location increases with 74% certainty; which is statistically insignificant.
The Control Period had 127 position changes which resulted in a net loss of 43 position drops while the EXIF Test Period ended with 126 position changes with a net loss of only 14 positions.
Adding EXIF data allegedly had no impact on the number of locations with increased rank but appeared to have a hand in preventing overall rank loss.
Combining “Near Me” Tests
This test combines the 27 totals from each test and uses 54 locations as the total number of locations tested.
Control Period (9/25/24 – 11/1/24)
34 Locations lost position
- 139 Total drops
13 Locations gained position
- 84 Total increases
281 Total position changes
- 55 Net decreases
EXIF Test Period (11/1/24 – 12/1-24)
19 Locations lost position
- 124 Total drops
22 Locations gained position
- 140 Total increases
264 Total position changes
- 16 Net increases
Conclusion:
The EXIF Test Period performed 70% better than the Control period in terms of total location increases with 97% certainty; which is statistically significant.
The Control Periods had 281 position changes which resulted in a net loss of 55 position drops while the EXIT Test Periods ended with 264 position changes with a net gain of 16 positions.
Adding EXIF data allegedly had a positive impact.
Test #4: “Lawn Care Near Me” Center of Business of Address
This tested whether targeting different towns with geotagged images affected the rank of the business in the specific town where their location was located despite the EXIF data targeting a different town within their service area.
Control Period (9/25/24 – 11/1/24)
During the Control Period, there were 58 total position changes ending with a net loss of 2 position drops.
10 Locations lost position
- The average position drop was -3
- 30 Total drops
7 Locations gained position
- The average position increase was 4
- 28 Total increases
EXIF Test Period (11/1/24 – 12/1-24)
During the Test Period, there were 90 total position changes ending with a net loss of 50 position drops.
14 Locations lost position
- The average position drop was -5
- 70 Total drops
5 Locations gained position
- The average position increase was 4
- 20 Total increases
Conclusion:
The Control Period performed 41% better than the EXIF Test Period in terms of total location increases with 75% certainty; which is statistically insignificant.
The Control Period had 58 position changes which resulted in a net loss of 2 position drops while the EXIF Test Period ended with 90 position changes with a net loss of 50 positions.
EXIF data added to towns not located at the pin allegedly had no impact on the pinned location. However, the control period kept net loss to a minimum at the center of the pin when no EXIF data was specified.
Test #5: “Lawn Care [Target Town]” (ATRP)
ATRP stands for “Average Total Rank Position”. This is the average rank position that changes across the board and doesn’t focus on a specific town or part of the service area.
Control Period (9/25/24 – 11/1/24)
During the Control Period, there were 29 total position changes ending with a net gain of 7 positions.
11 Locations lost position
- The average position drop was -1
- 11 Total drops
9 Locations gained position
- The average position increase was 2
- 18 Total increases
EXIF Test Period (11/1/24 – 12/1-24)
During the Control Period, there were 44 total position changes ending with a net loss of 2 position drops.
12 Locations lost position
- The average position drop was -2
- 24 Total drops
11 Locations gained position
- The average position increase was 2
- 22 Total increases
Conclusion:
The EXIF Test Period performed 0% better than the Control Period in terms of total location increases with 50% certainty; which is statistically insignificant.
The Control Period had 29 position changes which resulted in a net gain of 7 positions while the EXIT Test Period ended with 44 position changes with a net loss of 2 positions.
EXIF data added to specific target towns allegedly had no impact on the overall ranking of the service area. However, the control period kept net loss to a minimum in the total grid when no EXIF data was specified.
Test #6: “Lawn Care Near Me” (ATRP)
Control Period (9/25/24 – 11/1/24)
During the Control Period, there were 37 total position changes ending with a net gain of 7 positions.
15 Locations lost position
- The average position drop was -1
- 15 Total drops
11 Locations gained position
- The average position increase was 2
- 22 Total increases
EXIF Test Period (11/1/24 – 12/1-24)
During the Test Period, there were 41 total position changes ending with a net loss of 15 position drops.
14 Locations lost position
- The average position drop was -2
- 28 Total drops
13 Locations gained position
- The average position increase was 1
- 13 Total increases
Conclusion:
The Control Period performed 100% better than the EXIF Test Period in terms of total location increases with 73% certainty; which is statistically insignificant.
The Control Period had 37 position changes which resulted in a net gain of 7 positions while the EXIT Test Period ended with 41 position changes with a net loss of 15 positions.
EXIF data added to specific target towns allegedly had no impact on the overall ranking of the service area. However, the control period kept net loss to a minimum in the total grid when no EXIF data was specified.
Test #7: “Lawn Care [Target Town]” (SoLV)
SoLV stands for “Share of Local Voice”. SoLV is a metric Local Falcon uses to measure how often a business shows up in the top three positions of the map pack on Google.
Control Period (9/25/24 – 11/1/24)
6 Locations lost position
- The average percentage decrease in rank was 6%
7 Locations gained position
- The average percentage increase in rank was 6%
EXIF Test Period (11/1/24 – 12/1-24)
7Locations lost position
- The average percentage decrease in rank was 11%
6 Locations gained position
- The average percentage increase in rank was 8%
Conclusion:
The Control Period performed 17% better than the EXIF Test Period in terms of total location increases with 63% certainty; which is statistically insignificant.
EXIF data added to specific target towns allegedly had no impact on the overall ranking of areas in the top 3 results for target city queries.
Test #8: “Lawn Care Near Me” (SoLV)
Control Period (9/25/24 – 11/1/24)
9 Locations lost position
- The average percentage decrease in rank was 9%
8 Locations gained position
- The average percentage increase in rank was 7%
EXIF Test Period (11/1/24 – 12/1-24)
10 Locations lost position
- The average percentage decrease in rank was 10%
7 Locations gained position
- The average percentage increase in rank was 12%
Conclusion:
The Control Period performed 15% better than the EXIF Test Period in terms of total location increases with 62% certainty; which is statistically insignificant.
EXIF data added to specific target towns allegedly had no impact on the overall areas in the top 3 results for “near me” queries”
Conclusion
In the 8 tests conducted (condensed to 6 categories), the geotagged images test period only performed better in one category.
- “Lawn Care [Target Town]”: Control Period performed better
- “Lawn Care Near Me”: Test Period performed better
- “Lawn Care [Target Town] ATRP: No changes in either period
- “Lawn Care Near Me” ATRP: Control Period performed better
- “Lawn Care [Target Town] SoLV: Control Period performed better
- “Lawn Care Near Me” SoLV: Control Period performed better
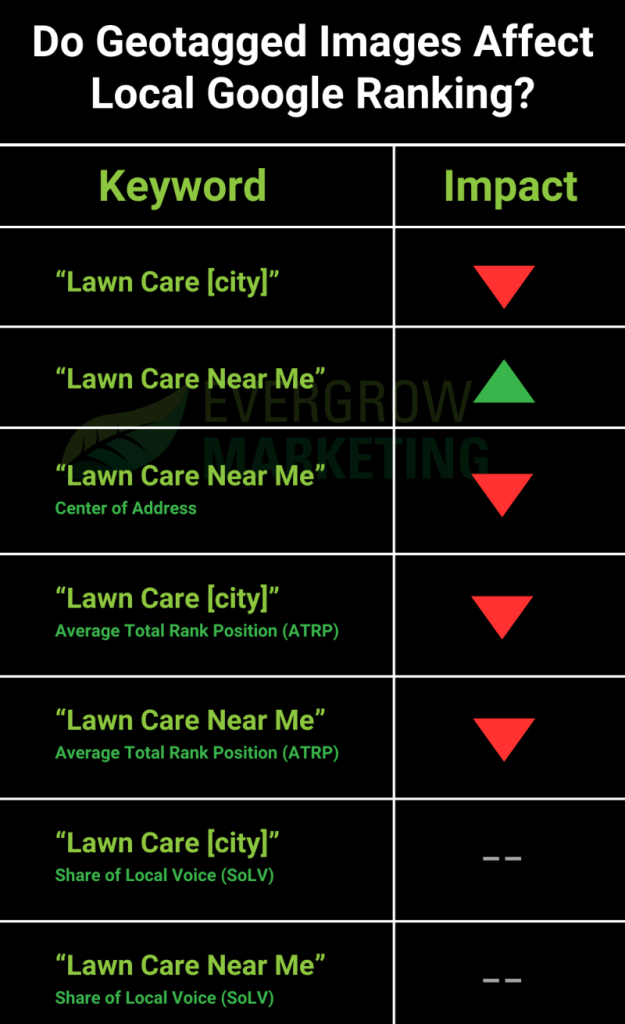
Adding coordinates to an image’s EXIF data and uploading to a Google Business Profile seems to exclusively affect “near me” queries in the area of relation to the target coordinates. However, it does not affect queries specifying a specific town or city.
The other unintended side effect that using geotagged images seems to have is a negative impact on rankings for locations that are not the targeted location in the EXIF data. This is indicative of only “near me” searches.
My Thoughts
There are more impactful things that can be done than adding coordinates to EXIF data to increase local rankings. My thoughts still align with the findings from Joy Hawkins and Tim Kahlert.
However, SEOs should not be discredited for insinuating that geotagged images do, in fact, have an impact on rankings. I simply believe that it isn’t worth it to do for a few reasons.
Reason #1:
You risk losing rank in areas where you’re not adding images for “near me” searches. That means the only way to counter it is to add geotagged images for every service area which can be dozens every week.
Businesses likely don’t have that many images to add and that many images won’t add anything of value to the actual business profile when a customer is looking through them.
Reason #2:
If adding EXIF data actually does have an impact on ranking, especially coordinates, that makes the algorithm a series of checkboxes. When optimizing for an algorithm becomes a systematic approach, no content or results are unique and search engines must find alternative methods for determining what is the best result for the searcher.
Reason #3:
There are far more things businesses can be doing to improve their local rank and brand presence than something as tedious and minimal as this.
Honestly, I don’t even know if how in-depth we went into this test was even worth the time and the effort. The tests Joy and Tim ran themselves came to the same conclusions as I did. My only hope is that this puts a lot of the arguing to bed.
Those who work at Google and know exactly how local rank works and what things are considered are probably laughing at me and all of us putting effort into this for something that is so obvious to them.
0 Comments